Question
A lot of information is available showing the mathematical development of the power spectral density function (PSD) unit of measure. This article will provide a practical explanation for PSD and its practical applications in testing.
Answer
What is it?
PSD, also called acceleration spectral density (ASD), is widely used in random vibration testing applications and is intended primarily as a tool for cancelling out the effect bandwidth of a frequency spectrum. PSD is a unit of measure, described in terms of energy per "filter", used to identify and denote energy strength deviations. It is possible to obtain the total energy within a specific frequency range by taking the root sum squared of the PSD points within the specified range. Proper computation of PSD is achieved directly via FFT spectrum analysis and then transforming it, taking into account actual analyzer filter bandwidth.
Let us assume that by selecting the resolution of a random vibration system, we find that we have a bandwidth choice of 160 Hz, 40 Hz and 10 Hz. We are going to take data from 20 to 2000 Hz. The random vibration controller is now set for 10 Hz resolution and a sine test signal of 1 grms is applied at 1000 Hz. Next, the resolution is changed to 40 Hz, but our reading at 1000 Hz now reads 2 grms! What could have gone wrong? As a reality check, we try setting the FFT system to 160 Hz and are now reading 4 g rms. Three different readings have now been obtained with the same vibration level and frequency. What did we do wrong?
What happened is simply that the analyzer's bandwidth was not taken into account. The problem, as described above, was common in the early days of vibration testing, causing many hours of testing to be essentially useless, as there was no standard for reporting the data. As a result, the use of PSD was widely accepted. In the case of a digital FFT system, each line of resolution can be viewed as a discrete analog filter. The actual resolution must also take into account the weighting function, which was omitted for the purpose of understanding this concept. Rather than a single filter, we need to look at a group of filters. For example, if we are looking from 10 Hz to 1000 Hz and desire a resolution of 10 Hz, we would require 100 filters, tuned to 100 frequencies ranging between 10 Hz to 1000 Hz, with each filter having a bandwidth of 10 Hz.
As further illustrated in the chart below (under grms), signal amplitude will also change as we adjust the bandwidth. If we applied 1 grms in the aforementioned example and changed the filter bandwidth to 40 Hz, we would now see a reading of 2 g rms.
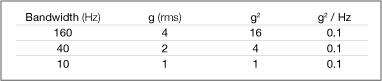
Figure 1
It is desirable to normalize data to a common value that will compensate for the difference in analyzer bandwidth, thus eliminating ambiguity. The answer is to incorporate the use of PSD within the testing environment. In the case of PSD, we actually divide the amplitude squared by the selected bandwidth and thus cancel out the effects of filter bandwidth. The table, above, puts this concept into prospective (please refer to the column marked g
2/Hz).
So where does the grms fit? In the world of random sine testing, we have become accustomed to working in units of g peak. Since a random event is a non-periodic event, it is necessary to statistically determine the level, thus RMS (root mean squared) is used.
Most vibration controllers and analyzers will also display and/or calculate "total grms." While test specifications may only specify PSD levels in the test profile, the total grms level is important for calculating a shaker's overall capacity to perform the test. The total grms is calculated as follows:
A12+A22+A32..........
Where: A is the amplitude (in g's) at each filter, or digital line.
While a sine signal was used as an example. PSD is most common in random vibration testing.