Background: The following article discusses an experimental concept developed by an Endevco customer using an Endevco® model 133 three-channel piezoelectric signal conditioner. The unit was working well within their existing measurement system. The customer had wanted to tap the signal and convert it into DC output for a trip point application. His request was for a simple circuit that he could self-build and test. Although the concept was known and understood to be experimental in nature, the customer had plans to permanently install if satisfied with the results.
As a general rule, Endevco does not recommend operation of its products beyond manufacturers' published specifications, nor outside of warranty terms and conditions. It is important to note that the
Endevco model 133 is in no way designed nor specified by Endevco for use as a permanently installed continuous condition monitoring device. The article is solely for educational reference only, and the experiment should not be construed in any way as intended to offer know-how on a viable technology alternative for such requirements. Instead, Endevco is pleased to recommend its Vibro-Meter VM600 continuous condition monitoring system, which offers multiple "fail-safe" features to safely handle multiple types of rotating machinery failure scenarios.
Experimental question:
I am using the Endevco model
7201-50 piezoelectric accelerometer and the model 133 three-channel piezoelectric signal conditioner for rotational shaft vibration monitoring. The shaft is rotating at about 1800 rpm. Can you suggest how to provide a simple DC output corresponding to the vibration level? I also want to be able to manually downscale the output level. The DC output level will be used as threshold trip point input to our programmable logic controller (PLC). It must be manually adjustable from 10% to 90% of signal conditioner output.
Experimental answer:
The Endevco model 133 is a three-channel signal conditioner for use with both Isotron® (IEPE-type) and charge output piezoelectric accelerometers. It does not offer an external DC output. However, the available AC output can be rectified and filtered to generate necessary DC output. The circuit schematic as shown in Figure 1, below, will provide DC output corresponding to the AC output signal. The output can be further downscaled by adjusting the R2 linear potentiometer.
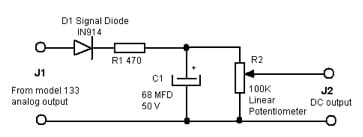
Figure 1
Circuit description:
The circuit shown in Figure 1 is a classical half-wave rectifier configuration, with three passive and one diode component. The AC output signal coming from model 133 is connected to J1. The AC signal is rectified by the diode D1, allowing the positive swing to pass thru while blocking the negative swing. R1 serves as the isolation resistor between the model 133 output and the rectifier circuit. C1 is the filter capacitor and R2 is the discharge path. The filtered DC output can be further scaled down by the potentiometer R2. The charging time constant is R1 x C1. The discharge time constant is R2 x C1. It is important that the monitoring instrument has 1 meg-ohm or higher input impedance to avoid loading the rectified DC output at J2. The DC output voltage will always be less than the AC pk input voltage due to the forward voltage drop of the diode D1 and the loading effect of R2. Bench test results are shown in both Table 1a (10 VAC pk input) and Table 1b (5 VAC pk input). The prototype circuit is shown in Figure 2.
Note: Since the potentiometer is not necessary for bench testing, a fixed 100K resistor was used for R2 instead of a potentiometer.
It is noteworthy that this simple circuit requires no power supply for operation and therefore dissipation is minimal, making it conducive to more prolonged operating conditions. At maximum 10 VAC input, the circuit only dissipates approximately 1 MW peak every half AC cycle. For comparative purposes, a typical ¼ watt resistor can dissipate 250 MW of continuous power. The output deviation is very much a function of component drift, which is also very negligible.
| Frequency Hz |
DC volt output |
Ripple volt pk |
| 0.8 |
8.9 |
1.8 volts |
| 5 |
8.8 |
0.1 |
| 50 |
8.8 |
0.02 |
| 500 |
8.8 |
0.008 |
| 1000 |
8.8 |
Not readable in oscilloscope |
Table 1A: AC output from the model 133 set to 10V pk and R2 = 100K
| Frequency Hz |
DC volt output |
Ripple volt pk |
| 0.8 |
4.2 |
0.7 |
| 5 |
4.2 |
0.04 |
| 50 |
4.2 |
0.01 |
| 500 |
4.2 |
0.004 |
| 1000 |
4.2 |
Not readable in oscilloscope |
Table 1B: AC output from the model 133 set to 5V pk and R2 = 100K
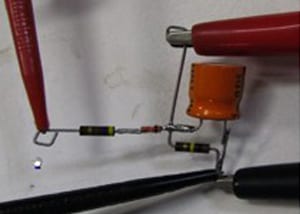
Figure 2: Prototype circuit
Figure 2: Prototype circuit
Experimental circuit performance:
The design concepts described here, and others like it, are very classic simple circuits that have been used for many years within military and aerospace, electronics, semiconductor processing, and other related applications. The building of the circuit itself is the sole responsibility of the customer. Endevco does not provide performance specifications for such experimental devices, other than to offer the typical test results of a circuit prototype for customer reference.